
Hey everyone, it’s the long awaited and elusive part 4 that I’ve been referencing in my other articles. To be honest, I may have forgotten much of the changes I’ve made so I’ll keep it concise in those sections, I never finished off the work so I will be more precise about that part and I’ve also opted to start writing drafts as I’m actually doing the project so I don’t hit that issue again.
So I left my last article with the following points to cover:
- Adding article meta data
- Modularising my code
- Clean up the contact email approach
- Protecting against security threats
- Search Engine Optimisation
- Feedback from users
- Hits per page
Contact email validation:
I guess the easiest place to get started is the contact email approach. What I meant by this is that I had no validation in place and one day received an email with bogus details which was probably someone testing me… You got me! For that, I settled on the second post here:
https://stackoverflow.com/questions/46155/how-to-validate-an-email-address-in-javascript
Every other part was relatively easy and I settled upon this code:
function validateEmail(email) {
    const re = /^[^\s@]+@[^\s@]+\.[^\s@]+$/;

    return re.test(String(email).toLowerCase());
}
	function sendEmail() {
	    //Verify inputs
	    if(validateEmail($('#email').val())){
	        var value = $("#name").val();
            if (value === "" || value == "please enter your name"){
                alert("Please enter your name");
            }else{
                var value = $("#message").val();
                if (value === "" || value == "please enter your name"){
                    alert("Please enter a message");
                }else{
                    $.post('./php/email.php', $('form').serialize(), function(response) {
                        // Log the response to the console
                        if(response == 1){
                            alert("Email sent successfully! I shall be in contact as soon as possible.");
                        } else {
                            alert("An error has occurred, if you could please email manually if this persists");
                       }
                    });
                }
            }
	    }else{
	        alert("Please enter a valid email");
	    }
And for my form button:
<a class="btn btn-primary btn-lg" href="javascript:sendEmail();">Send »</a>So that was easy, let’s plough on.
Modularing my code:
This one is fairly easy to describe, I moved alot of code into sub directories where it seemed sensible. I then link css sheets, import javascript, include php files. All the usual stuff, one trick though I’m particularly happy with is doing the same with html code. You see this in building my subscribe function article and I move the universal menu to one html page. I then use file_get_contents to pull this in with PHP on load:
<?php echo file_get_contents("./templates/subscribe.html"); ?>So that’s another one fairly well covered. It might seem like I’m rushing through but this is mainly because I want to get onto the more in-depth subjects.
Hits per page
So for this one I wanted to keep it simple, for now, I don’t have a display, I just wanted to store the data first. I think what I’ll do with this is eventually use NXGWeb. Ah heck, let’s go ahead and do it!
The reason I want to use NXG Web is I’m not very savvy when it comes to angular or Node.js, maybe with my new job I can justify taking some training on it, maybe I should utilise my LinkedIn learning before it expires and use that. We’ll see, but it’s definitely a gap I’m aware of. For now, I want to get this written up quickly as there’s lots to do.
So my counter works as an include php file in each page. It then takes the url and pops this into a database, like so:
$db_host = 'localhost';
$db_username = 'root';
$db_password = '3Dzwftjb';
$db_name = 'MyContent';
$db_table = 'hit_counter';

$date = date('Y-m-d H:i:s');
$db = mysqli_connect ($db_host, $db_username, $db_password, $db_name) or die("Host or database not accessible");

$sql_call = "INSERT INTO ".$db_table." (DateTime, IPAddress,Page) VALUES ('".$date."','".$_SERVER['REMOTE_ADDR']."','".$_SERVER['REQUEST_URI']."')";
mysqli_query($db, $sql_call) or die("Error while entering");
mysqli_close($db);
That’s simple enough, later I might mine the data a bit more but right now I just want to show overall activity over time.
The first thing I need to do is get the data via PHP and push this out as JSON so NXG can read and iterate through it. To keep my memory fresh I use this example to start with:
https://www.w3schools.com/php/php_mysql_select.asp
So to get this into JSON format I arrived at this article:
https://www.kodingmadesimple.com/2015/01/convert-mysql-to-json-using-php.html
And this is the code I arrive at:
<?php
$db_host = 'localhost';
$db_username = 'root';
$db_password = '';
$db_name = 'MyContent';
$db_table = 'hit_counter';

// Create connection
$conn = new mysqli ($db_host, $db_username, $db_password, $db_name) or die("Host or database not accessible");

// Check connection
if ($conn->connect_error) {
  die("Connection failed: " . $conn->connect_error);
}
$sql = "SELECT * FROM hit_counter";
$result = $conn->query($sql);
$emparray = array();
if ($result->num_rows > 0) {
  // output data of each row
  while($row = $result->fetch_assoc()) {
    $emparray[] = $row;
  }
  echo json_encode($emparray);
} else {
  echo "0 results";
}
$conn->close();

?>
So now we go to NXG to create my interface to view the data.
I’m going to start by using postman to confirm the format:
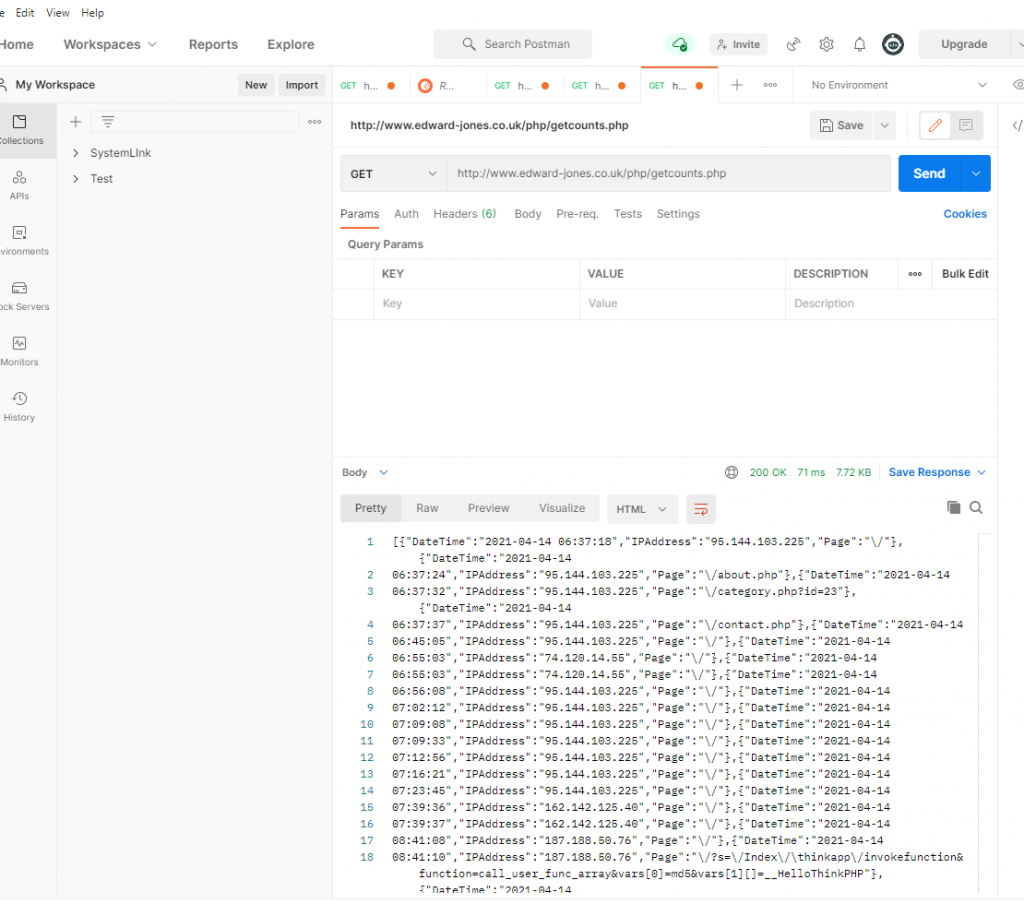
It can be a bit annoying figuring out NXG problems, it doesn’t naturally add CORS headers to requests unless that’s configured in your .htaccess so when you’re on your development machine it’s not possible to test things easily. I have to upload to my server at each build, that is why I use postman as a first pass test system.
With my first iteration I managed to get my data converted to JSON though:
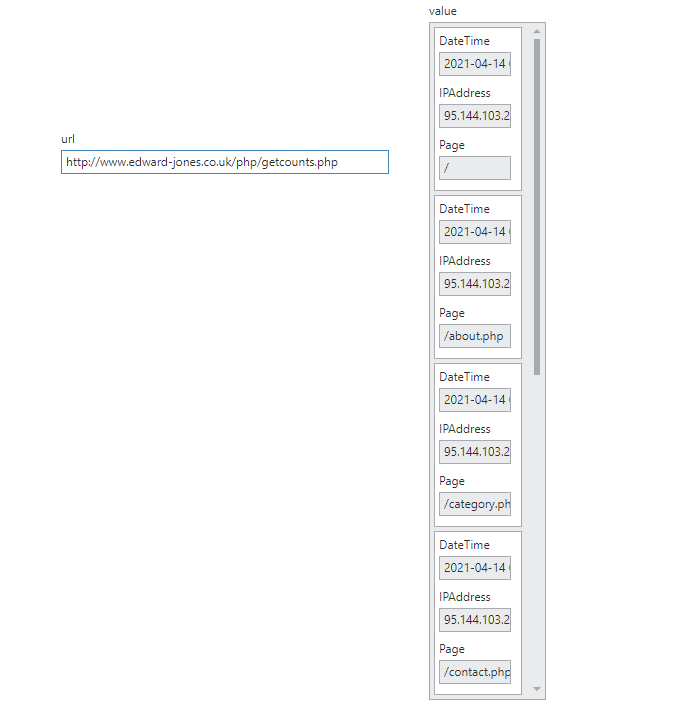
My panel was:
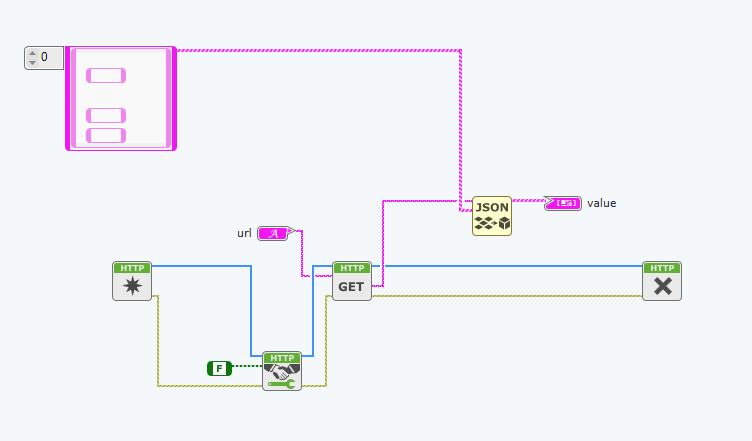
A very simple program as you can see. What I realised here was a significant gap in the NXG Palette, I had no way to convert a string timestamp into a numeric or timestamp that I could display on a time graph. Therefore I needed to convert this at the PHP side. I managed to do it like so:
$newval = array();
  while($row = $result->fetch_assoc()) {
	$dt   = new DateTime($row['DateTime']);
	$newval['DateTime'] = $dt->getTimestamp();
	$newval['IPAddress'] = $row['IPAddress'];
	$newval['Page'] = $row['Page'];
    $emparray[] = $newval;
  }
I then hit another issue, how can I graph it? Well, I then decided to just get the day of the year and focus my view on this year since that’s all my data (I’ll need to fix that next year! Hopefully I’ll have implemented an angular approach by then).
This article helped in the change:
Okay so now I have that, I need in NXG to sum the days of activity. So programmatically what I need to do is have a 2D array. One which holds the day of year and another as a count. It was quite tricky to then manipulate the data to show what I needed but I resulted upon this block diagram where it’s mostly array manipulation:
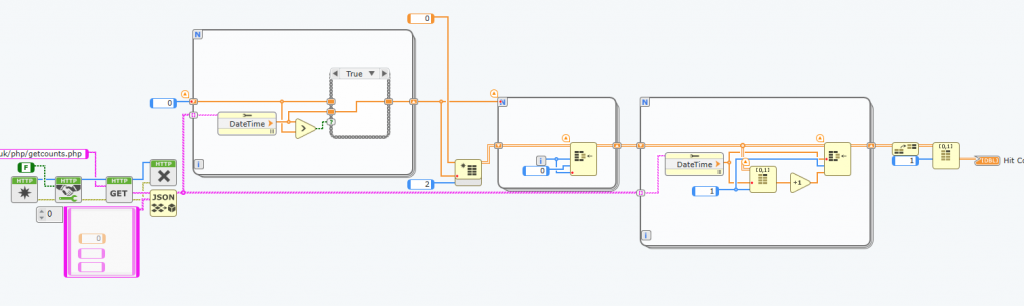
Hey presto, I have a view of also viewing the data:
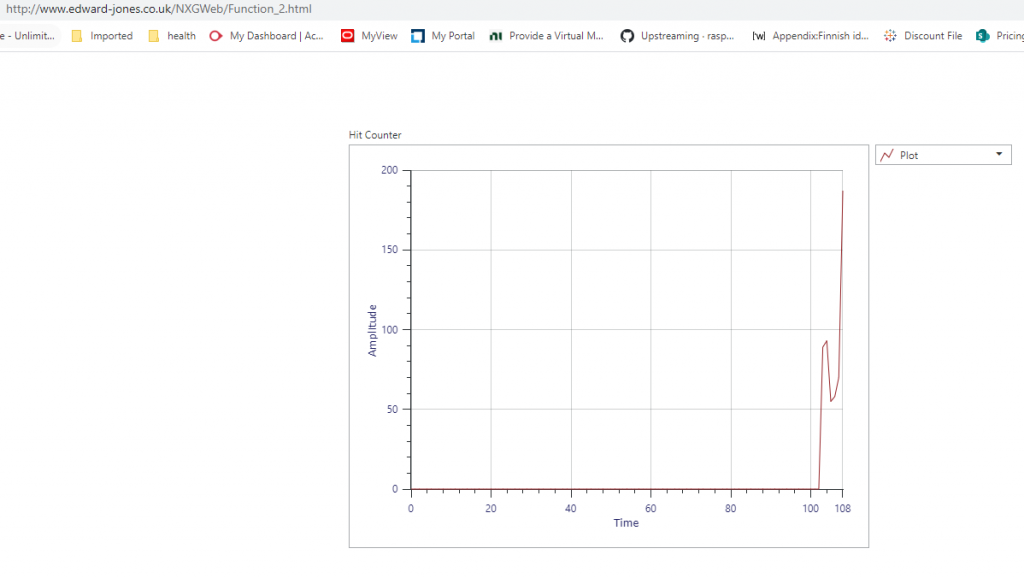
This is very basic of course but a good starter. Now, I had many other points to cover but I feel this article is long enough, let’s move for another part in a new article for the rest.