
So recently I need to refresh my skills on EPICS and also expand them a little further. In this tutorial I’m going to setup the simple example ioc, before I’ve done this in Linux but now I’m going to work with Windows instead. Few pitfalls with Windows so let’s get with setting up your system and some important notes here.
So, just like this article suggests:
You need to install, well, I went with Strawberry Perl, Visual Studio 2019 and 7zip. Next, download EPICS, I’ve gone with the 3.15 stable release, extract with 7zip. I like to place it within the C directory itself as the command line is troublesome to navigate, if only they had a right click open terminal like Linux!
Anyway, so navigate there, set the HOST ARCH. Note you must set this everytime you start a new command line windows for working with EPICS and building new modules/core.
set EPICS_HOST_ARCH=windows-x64Similar to the above warning, then set our compiler:
"C:\Program Files (x86)\Microsoft Visual Studio\2019\Community\VC\Auxiliary\Build\vcvarsall.bat" amd64As the article says, but since I’m using strawberry perl, now gmake:
gmakeNow that it’s built, we need to add the bin directory to our system PATH variable. If you followed my directions to the letter, it should be here:
C:\EPICS\base-3.15.8\base-3.15.8\bin\windows-x64In Windows 10, open File Explorer, right click “This PC” and then select Properties, in the new window, depending on the window size it’s either at the right panel or bottom, select “Advanced System Settings” and in the new dialog, “Environment Variables” and then select under the System Variables, PATH and Edit, then Add. This will walkthrough it all:
https://www.architectryan.com/2018/03/17/add-to-the-path-on-windows-10/
Add it and then log out and back in, or restart, otherwise this won’t take effect and you’ll have to do it later anyway.
Okay so next, what is this example ioc? Well, first let’s create a new directory and then use the makeBaseApp perl script to create the example (the second to the right describes that we’re building from the example template, the furthest value to the right is the name of our App).
https://epics.anl.gov/base/R3-14/12-docs/AppDevGuide/node3.html#SECTION00322000000000000000
mkdir example
cd example
perl ../bin/windows-x64/makeBaseApp.pl -t example myexample
perl ../bin/windows-x64/makeBaseApp.pl -i -t example myexample
When prompted, enter our example name “myexample” to associate them correctly.
Okay, so now we should have everything together to build:
gmakeYou should definitely see a bin directory in the example directory now, otherwise something went wrong and you’ll need to read the output to see what happened, sometimes it can be this so make sure you have this installed:
https://www.microsoft.com/en-gb/download/details.aspx?id=26999
Now cd to the ioc* ioc* directories that got made:
cd ioc*
cd ioc*
Now run:
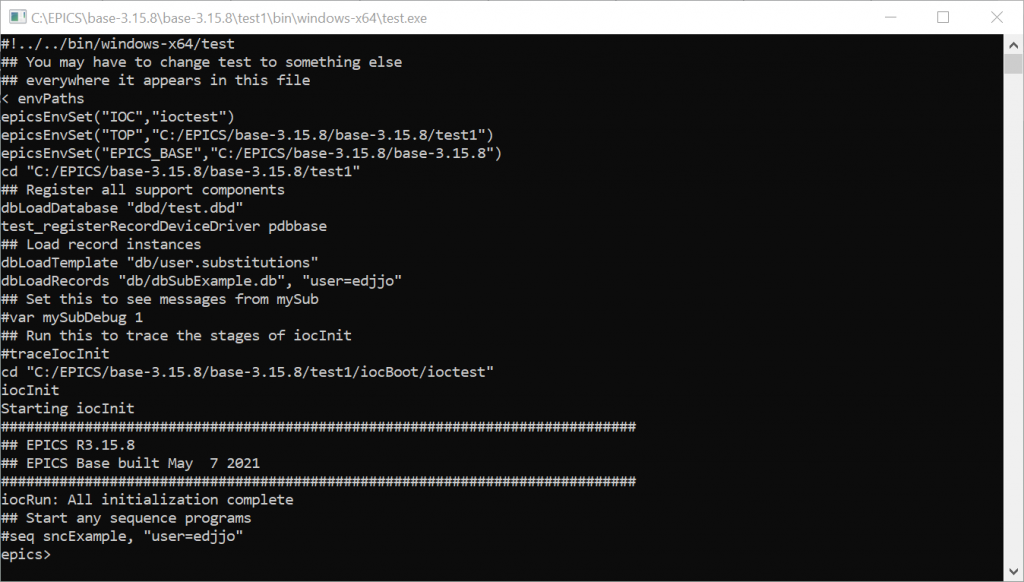
../../bin/windows-x64/myexample st.cmdYou should get this appearing:
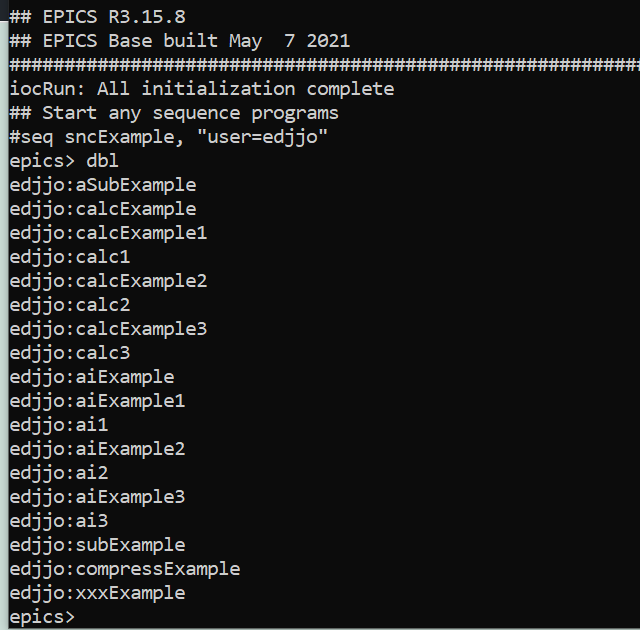
Okay so if you run dbl you should see some example variables:
Here I got caught out, camonitor won’t run here. As long as you set your system path earlier though, in a different command window (keep this one open and running), you can use camonitor:
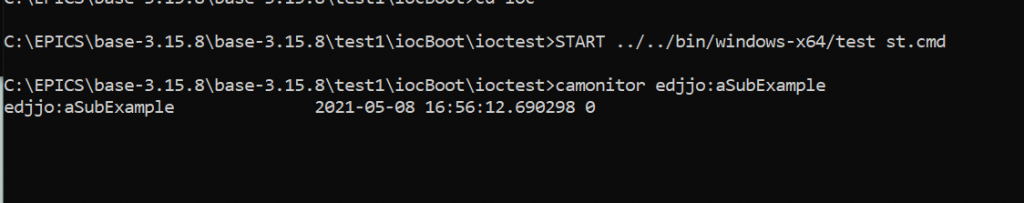
Okay bad example for the next bit, how about:
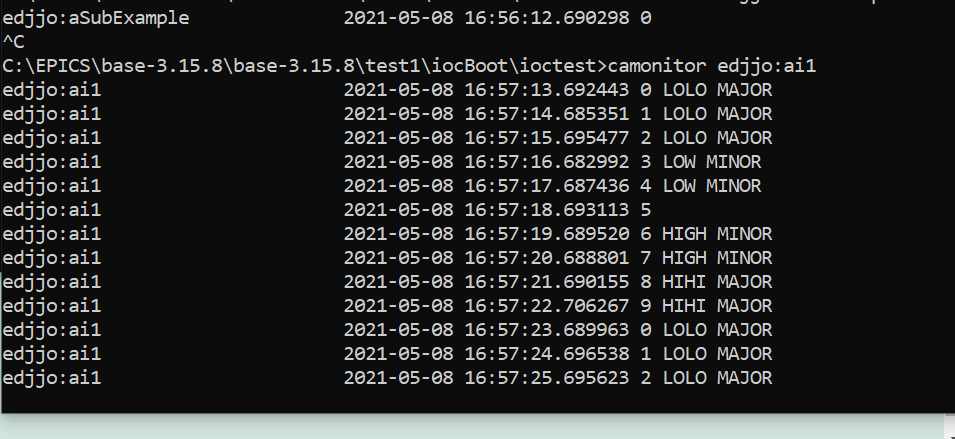
Great, a variable which changes as it runs (as its a simulated example).
The next bit is how to build a client. Okay so I chose Python, this is where you’ll definitely need the C++ Redistributables otherwise you’ll hit an error later. I originally decided on Qt5 to plot the data but looking at how that’s implemented, it’s very complicated and made it difficult to come up with a “simple example” and therefore opted for matplotlib instead. So first things first, install Python on your windows machine.
Note: use the Python website for a download – not the Windows App store, their version splits Python out and makes dependencies issues. Make sure to select custom and also “Add Python to PATH”, I also opted to add precompiled libraries, basically clicked all tickboxes.
Now I’ve decided to use pyepics:
https://pyepics.github.io/pyepics/overview.html#quick-start
So a good old pip install in a new command window.
I’m going to use caget from the above articles example, then plot it on a simple chart with nothing else and that will be where I finish up today. In the next article though I’m going to turn my raspberry pi into an EPICS device and then monitor it in python from my Windows machine. Fun! Re-using some of the items from my IoT (hardware and sensor wise) but all the code will be new, EPICS implemented.
It annoyingly took a while to find a good example but ended up with this:
This article really helped:
And this was my code:
import matplotlib.pyplot as plt
import numpy as np
import sys
from epics import caget, caput, cainfo
count = 0
while(1):
count = count + 1
num = caget("edjjo:ai1")
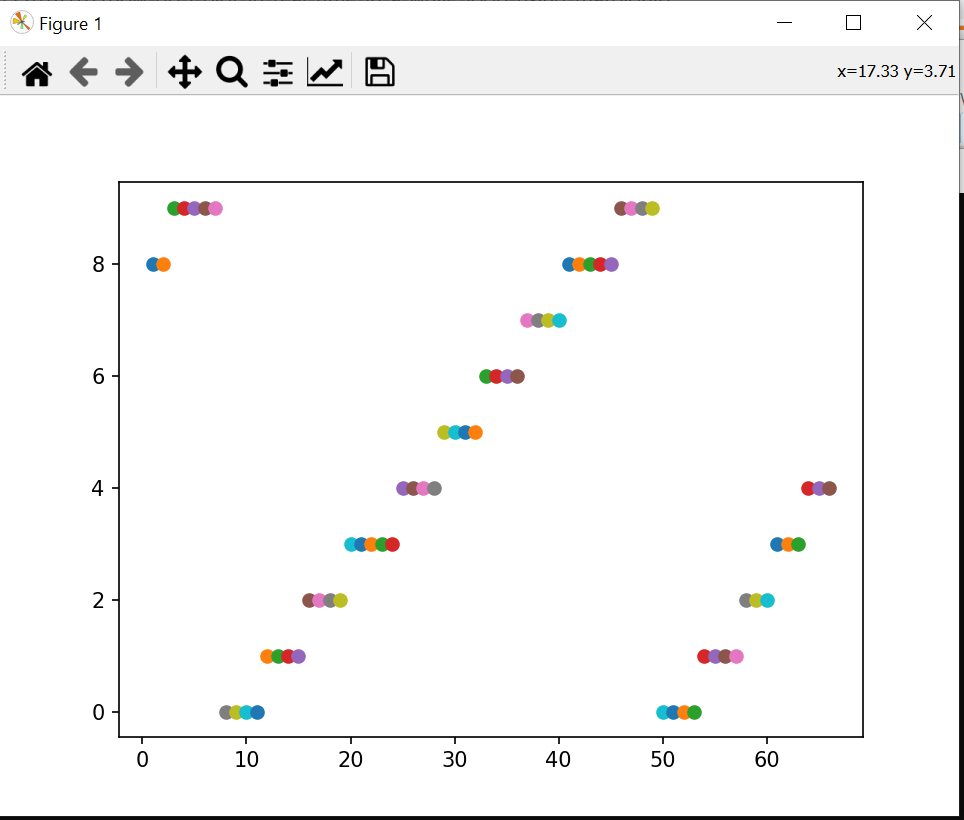
plt.scatter(count, num)
plt.pause(0.2)
plt.show()A few notes/areas for improvement:
- This graph will keep growing and slow down as it’s array becomes to large. Maybe we should manage that..
- The pause is too short and hence we get the same value in certain iterations. Maybe it should check for a value change and only plot if so, with a timestamp.
- No cancel method, was a bit tricky, had to keep grabbing the command prompt and clicking Ctrl+C, took a few attempts. Need to figure that one out…
But, for now, this was simply a proof of concept so I’m happy to leave it there :).
Great write-up, I am a big believer in commenting on blogs to inform the blog writers know that they’ve added something worthwhile to the world wide web!..